ggplot2の練習中
ggplot2は記法が独特なので敬遠してきたのですが、最近ggplot2を使うと良さそうな事案に遭遇したので勉強中です。
library(ggplot2)

p1 <- ggplot(iris, aes(Petal.Length, fill=Species))
p1 + geom_histogram() + opts(title="積み重ねヒストグラム")
p1 + geom_histogram() + facet_grid(Species~.) + opts(title="群別ヒストグラム")
p1 + geom_freqpoly(aes(color=Species)) + opts(title="度数分布")
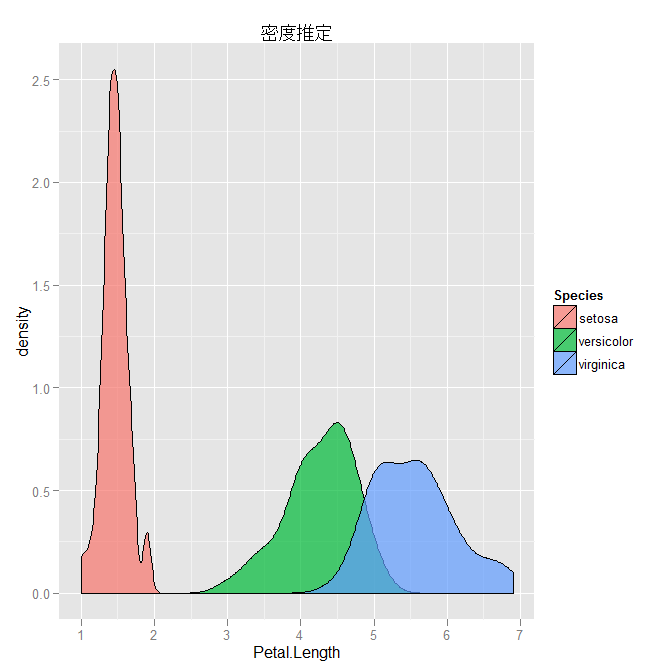
p1 + geom_density(alpha=0.7) + opts(title="密度推定")

ggplot(iris, aes(x=Species, y=Petal.Length)) + geom_boxplot() + geom_jitter(aes(color=Species)) + opts(title="箱ひげ図")

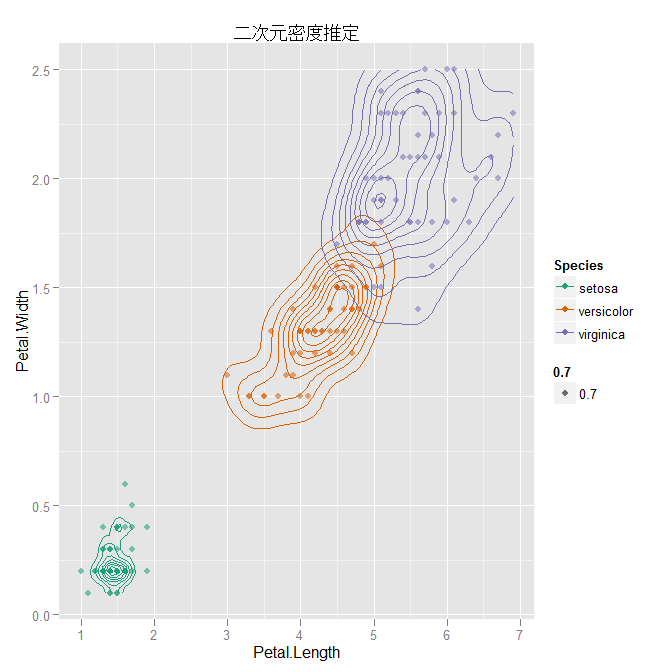
ggplot(iris, aes(x=Petal.Length, y=Petal.Width)) + geom_density2d(aes(color=Species)) + geom_point(aes(color=Species, alpha=0.7)) + opts(title="二次元密度推定") + scale_color_brewer(palette = "Dark2")


