文系でのRの利用した統計解析: グループごとのヒストグラムの表示
トラックバックできないので伝わらないかもしれませんが……
あやめのデータを例にして。
data(iris)
summary(iris)
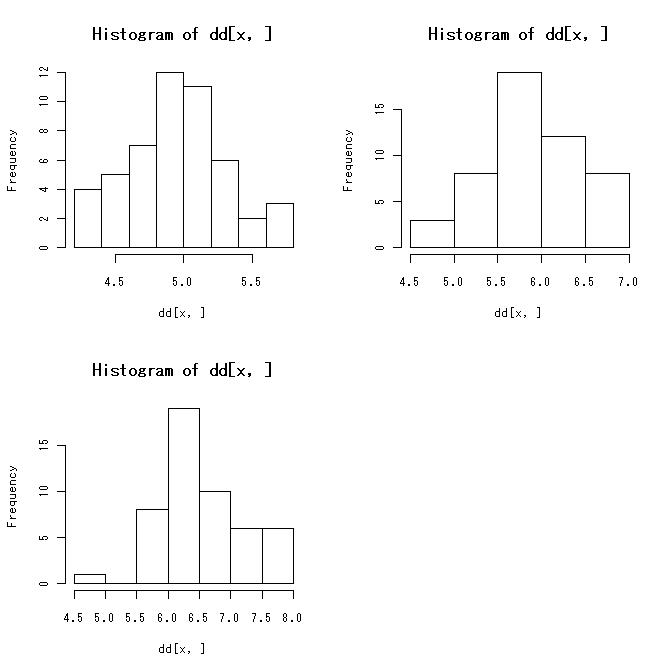
一番単純なのはbyかtapplyを使う方法。
しかしこれは如何せん見栄えがしない。
par(mfrow=c(2,2))
by(iris$Sepal.Length, iris$Species, hist)
ヒストグラムを確認しようと思えるぐらいのカテゴリ数であれば、すこし丁寧に一つ一つ描いた方がいいかもしれない。
par(mfrow=c(2,2))
hist(iris[iris$Species=="setosa",]$Sepal.Length, col="red",
  main="setosa", xlim=range(iris$Sepal.Length), xlab="Sepal.Length")
hist(iris[iris$Species=="versicolor",]$Sepal.Length, col="blue",
  main="versicolor", xlim=range(iris$Sepal.Length), xlab="Sepal.Length")
hist(iris[iris$Species=="virginica",]$Sepal.Length, col="green",
  main="virginica", xlim=range(iris$Sepal.Length), xlab="Sepal.Length")
latticeパッケージを使うともっとお手軽かつ美しく描けるかも。
library(lattice)
histogram( ~ Sepal.Length | Species, data=iris, type="count")
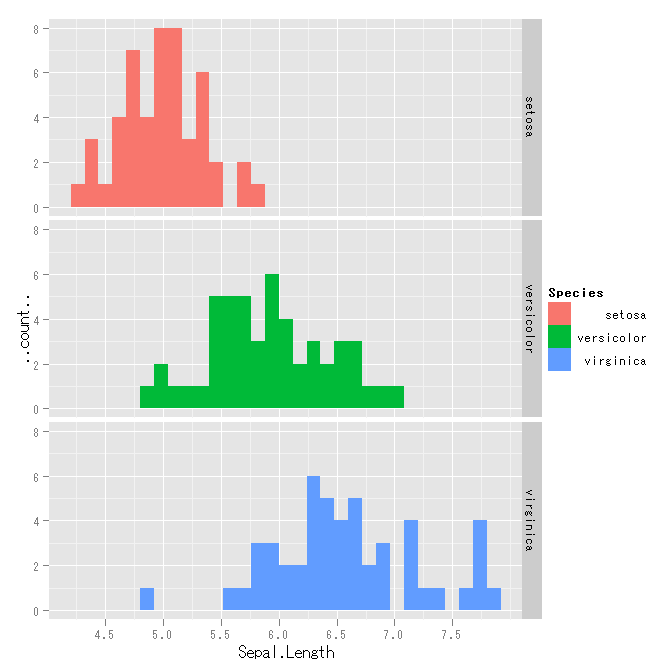
最近流行のggplot2だとこんな感じ?
library(ggplot2)
qplot(Sepal.Length, data=iris, facets = Species ~ ., fill=Species)


