■
メモ
http://flowingdata.com/2010/08/31/how-to-visualize-data-with-cartoonish-faces/
http://blogs.iq.harvard.edu/sss/archives/2006/11/chernoff_faces_1.shtml
青木先生
source("http://aoki2.si.gunma-u.ac.jp/R/src/face_plot.R", encoding="euc-jp")
source("http://aoki2.si.gunma-u.ac.jp/R/src/face_data.R", encoding="euc-jp")
test <- cbind(1:9,50)
pos <- c(1,rep(2,17),1)
x <- face.data(test, pos)
old <- par(mfrow=c(3, 3))
for(i in 1:9) {
face.plot(x[i,])
}
par(old)
■
メモ
library(RFinanceYJ)
library(aplpack)
library(RColorBrewer)

SINCE <- '2012-01-01'
DATE.END <- '2012-12-31'

Yahoo <- quoteStockTsData('4689.T',since=SINCE, date.end=DATE.END)
DeNA <- quoteStockTsData('2432.T',since=SINCE, date.end=DATE.END)
GREE <- quoteStockTsData('3632.T',since=SINCE, date.end=DATE.END)
Mixi <- quoteStockTsData('2121.T',since=SINCE, date.end=DATE.END)
CA <- quoteStockTsData('4751.T',since=SINCE, date.end=DATE.END)
GungHo <- quoteStockTsData('3765.Q',since=SINCE, date.end=DATE.END)
Intage <- quoteStockTsData('4326.T',since=SINCE, date.end=DATE.END)

X <- format(DeNA[,1], "%m/%d")
Y <- cbind(	Yahoo[,7]/Yahoo[1,7],
		DeNA[,7]/DeNA[1,7],
		GREE[,7]/GREE[1,7],
		CA[,7]/CA[1,7],
		Mixi[,7]/Mixi[1,7],
	#	GungHo[,7]/GungHo[1,7],
		Intage[,7]/Intage[1,7])
cols <- brewer.pal(7, "Dark2")
par(xaxt="n")
matplot(
	y=Y,
	lwd=2,
	col=cols,
	lty=1:6,
	type="l",
	xlab="date",
	ylab="per_close")
par(xaxt="s")
axis(1,at=1:length(X),labels=X)

#abline(h=1:5,lty=2,col="gray")
#legend(100, 4, c(	"Yahoo","DeNA","GREE","CA","Mixi","GunHo","Intage"),
#       lwd=2,lty=1:6, col = cols)

abline(h=seq(0.4,1.2,0.2),lty=2,col="gray")
abline(h=1,col="gray")
legend(1, 0.7, c(	"Yahoo","DeNA","GREE","CA","Mixi","Intage"),
       lwd=2,lty=1:6, col = cols)

library(animation)
# http://www.imagemagick.org
#Define path to convert.exe (http://www.imagemagick.org)
ani.options(
	convert = shQuote('C:/Program Files/ImageMagick-6.8.1-Q16/convert.exe')
	)

test <- function(){
	for (i in 1:nrow(DeNA)) {
	DAT <- rbind(DeNA[i,-1],GREE[i,-1])
	faces(DAT,print.info=FALSE, face.type=1, main=Yahoo$date[i],labels=c("DeNA","GREE"))
	}
}

saveMovie(test(),interval=0.3,moviename="TEST",movietype="gif",outdir=getwd())
Chernoff face
WIKIPEDIA http://en.wikipedia.org/wiki/Chernoff_face
元論文(1973) http://www.apprendre-en-ligne.net/mathematica/3.3/chernoff.pdf
http://flowingdata.com/2010/08/31/how-to-visualize-data-with-cartoonish-faces/
library(aplpack)
http://www.wiwi.uni-bielefeld.de/com/wolf/software/aplpack.html
representation of the rows of a data matrix by faces. The features paramters of this implementation are:
1-height of face
2-width of face
3-shape of face
4-height of mouth
5-width of mouth
6-curve of smile
7-height of eyes
8-width of eyes
9-height of hair
10-width of hair
11-styling of hair
12-height of nose
13-width of nose
14-width of ears
15-height of ears.
http://aoki2.si.gunma-u.ac.jp/R/face.html
library(symbols)
symbol(iris,type="face",scheme=3,sortby=2,colin=5)
http://www.e-stat.go.jp/SG1/estat/List.do?bid=000001027245&cycode=0
アニメーションパッケージについては
http://d.hatena.ne.jp/EulerDijkstra/20120129/1327834316
http://www.slideshare.net/sleipnir002/animation10-11306609
http://d.hatena.ne.jp/ryamada/20110809/1312750005
http://www.slideshare.net/mickey24/r-de-animation
http://menugget.blogspot.jp/2013/01/producing-animated-gifs-and-videos.html#more
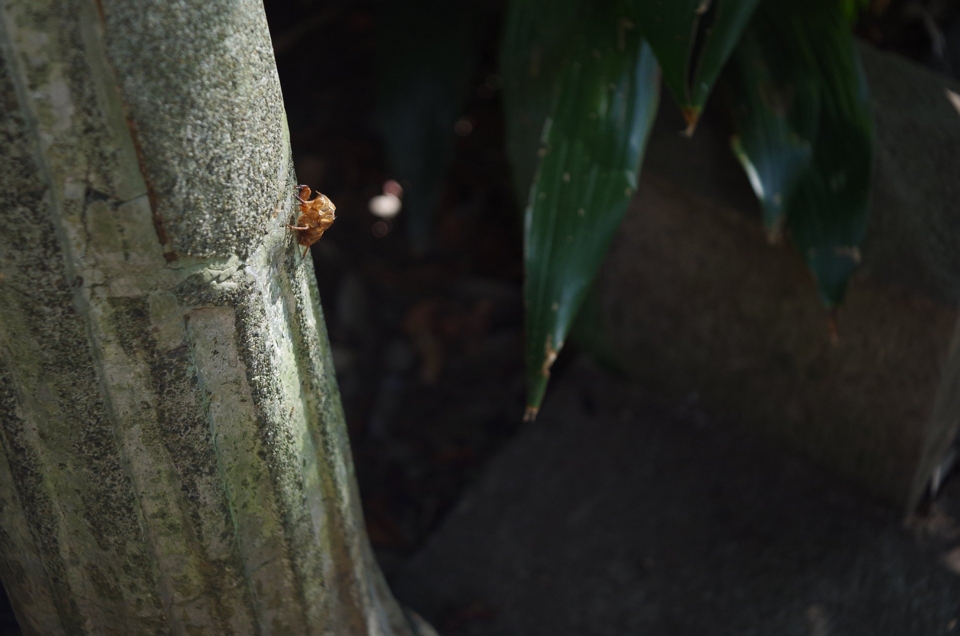
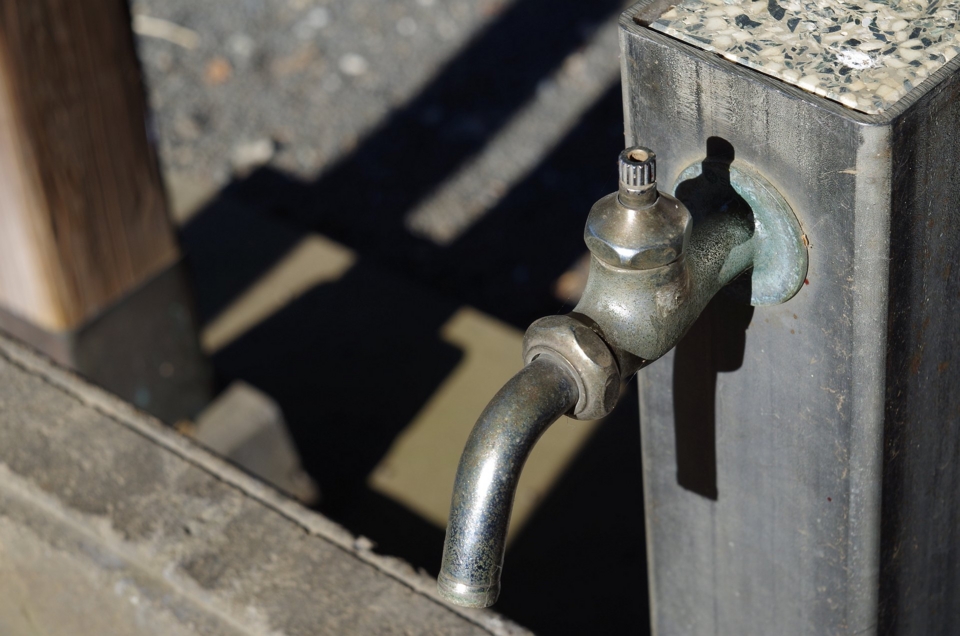
K-01 に KMZ INDUSTAR 50-2 50mm/F3.5 (M42) を付けて撮ったみた
先日購入したK-01が楽しくてたまらない。
何が楽しいって、マニュアルレンズで撮りやすいのが最高に楽しい。
で、ついにM42マウントのレンズにも手を出してしまった。
しかもロシア(ソ連)レンズ。
K-01にぴったりなパンケーキレンズ INDUSTAR 50-2。
もっとトイレンズっぽい写りかと思っていたら、いやいやスゲーよく写る!
今日はちょっと時間が取れたのでこの組み合わせで試し撮りしてきました。
っと、いい感じの写真だけ載せましたが、何しろ1959年に生産が始まった古いレンズです。
さらに元を辿れば1902年に設計されたTessarのデッドコピーなんだそうで100年以上前から使われているレンズ。
デジタル対応の最新レンズには敵わない部分ももちろんあるわけで。


逆光にはめっぽう弱く、こんな感じに盛大なフレアが出ます。
フードがあればだいぶましになりそうですが、そうすると小さくて薄いパンケーキレンズの利点が損なわれるような気もしますしねぇ。
ggplot2の練習中
ggplot2は記法が独特なので敬遠してきたのですが、最近ggplot2を使うと良さそうな事案に遭遇したので勉強中です。
library(ggplot2)

p1 <- ggplot(iris, aes(Petal.Length, fill=Species))
p1 + geom_histogram() + opts(title="積み重ねヒストグラム")
p1 + geom_histogram() + facet_grid(Species~.) + opts(title="群別ヒストグラム")
p1 + geom_freqpoly(aes(color=Species)) + opts(title="度数分布")
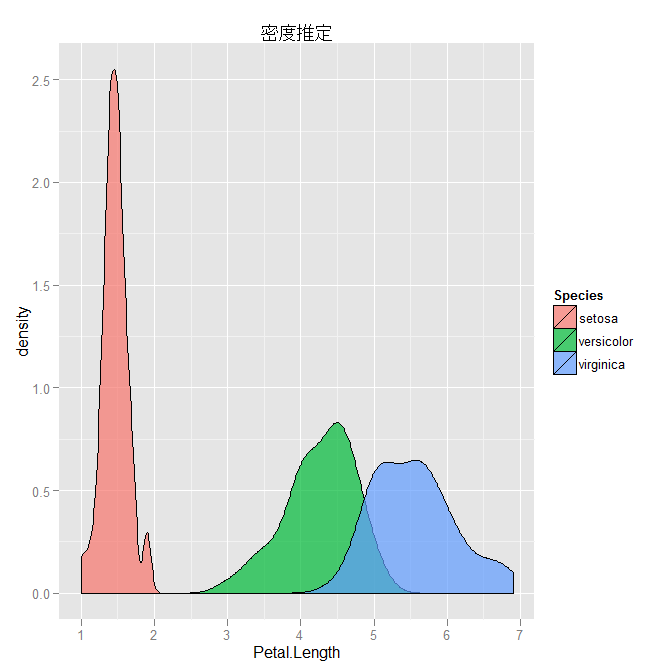
p1 + geom_density(alpha=0.7) + opts(title="密度推定")

ggplot(iris, aes(x=Species, y=Petal.Length)) + geom_boxplot() + geom_jitter(aes(color=Species)) + opts(title="箱ひげ図")

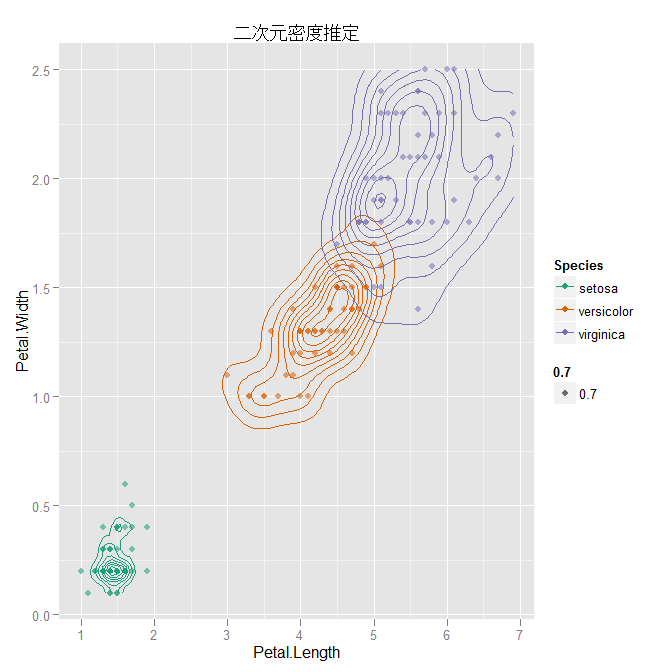
ggplot(iris, aes(x=Petal.Length, y=Petal.Width)) + geom_density2d(aes(color=Species)) + geom_point(aes(color=Species, alpha=0.7)) + opts(title="二次元密度推定") + scale_color_brewer(palette = "Dark2")
■
ネットワーク分析の再勉強。
# snaパッケージ
library(sna)
el.sna <- matrix(c(
   1, 2, 1,
   2, 1, 1,
   1, 3, 1,
   3, 1, 1,
   1, 4, 1,
   4, 1, 1,
   5, 2, 1,
   5, 6, 1,
   6, 5, 1,
   6, 2, 1,
   7, 2, 1,
   8, 2, 1,
   9, 2, 1,
  10, 2, 1,
  11, 2, 1,
  12, 2, 1,
  13, 2, 1,
  14, 3, 1,
  15, 3, 1,
  16, 3, 1,
  17, 3, 1,
  18, 3, 1,
  19, 3, 1,
  20, 3, 1,
  21, 4, 1,
  22, 4, 1,
  23, 4, 1,
  24, 4, 1,
  25, 4, 1), ncol=3, byrow=TRUE)
attr(el.sna, "n") <- 25

gplot(el.sna, mode="kamadakawai", displaylabels=TRUE)
gden(el.sna)   # 密度
gtrans(el.sna) # 推移性


# igraphパッケージ
library(igraph)
el.igraph <- graph.edgelist(matrix(c(
  "A", "B",
  "B", "A",
  "A", "C",
  "C", "A",
  "A", "D",
  "D", "A",
  "E", "B",
  "F", "B",
  "E", "F",
  "F", "E",
  "G", "B",
  "H", "B",
  "I", "B",
  "J", "B",
  "K", "B",
  "L", "B",
  "M", "B",
  "N", "C",
  "O", "C",
  "P", "C",
  "Q", "C",
  "R", "C",
  "S", "C",
  "T", "C",
  "V", "D",
  "W", "D",
  "X", "D",
  "Y", "D",
  "Z", "D"), ncol=2, byrow=TRUE))
plot(el.igraph, layout=layout.kamada.kawai, vertex.label=V(el.igraph)$name)
graph.density(el.igraph) # 密度
transitivity(el.igraph)  # 推移性
Rのバージョンアップ時のパッケージのアップデート方法
Rのバージョンアップの際、これまで使っていたパッケージも同時にアップデートしたいんだけど、毎回その効率的なやり方を忘れてしまうのでここにメモしておく。
ネタ元は神戸大の中澤先生のメモ( http://minato.sip21c.org/swtips/R.html )。
- 最新版のRをインストール
- 旧版のRのライブラリフォルダを最新版のRのライブラリフォルダに上書き。ただし既に同名のファイルやフォルダがある場合は上書きしない。
- 新しいバージョンのRを起動し、update.packages(checkBuilt=TRUE, ask=FALSE)を実行。
また、Rblas.dllの差し替えや、Rprofile.siteの書き換えも必要に応じて行うこと。
Rで「ガチャとは心の所作」 #TokyoSciPy #rstatsj
Tokyo.SciPy#3で id:AntiBayesian さんがLTされていた「ガチャとは心の所作」が非常に興味深かったのでRでもやってみました。
(もっとも、ustがなかったので私は発表資料を読んだだけですが…)
「ガチャとは心の所作」 d:id:AntiBayesian:20120318
ガチャのシミュレーション関数はこんな感じ。
# probが各アイテムの出現確率
# nopがガチャを回す人数(既定値は10000人)
# iter.maxが一人が回す回数の上限(既定値は10000回)
gacha.sim <- function(prob, nop=10000, iter.max=10000){
  nop.result <- numeric(nop)
  items <- length(prob)
  result <- matrix(sample(1:items, nop*iter.max, replace=TRUE, prob=prob),
                   iter.max)
  for (i in 1:nop) {
    for (j in 1:iter.max) {
      if (length(unique(result[1:j, i]))==items){
        nop.result[i] <- j
        break
        }
      }
    }
  list("result" = nop.result, "prob"=prob)
  }
二重ループで効率悪いのですが、きっと id:a_bicky さんや裏RjpWikiの中の人がもっと良い方法を示唆してくれるものと思います。
シミュレーションの実行はこんな感じで。
# ここでは4つの出現確率パターンで試してみる。
result1 <- gacha.sim(c(  1,  1,  1,  1, 1, 1))
result2 <- gacha.sim(c(100, 50, 10, 10, 3, 1))
result3 <- gacha.sim(c(  5,  5,  3,  3, 2, 1))
result4 <- gacha.sim(c( 10,  3,  2,  2, 1, 1))
シミュレーションの結果をヒストグラムにしてみましょう。
library(MASS)
windows(12, 9)
par(mfrow=c(2, 2))

x <- result1
truehist(x$result, xlim=c(min(x$result), max(x$result)),
         xlab="コンプまでの回数", ylab="人数", prob=FALSE)
legend(30,600,
       legend=c("出現確率 [1, 1, 1, 1, 1, 1]",
                paste("平均", round(mean(x$result), 1)),
                paste("標準偏差", round(sd(x$result), 1)),
                paste("中央値", median(x$result)),
                paste("最大値", max(x$result))))
par(new=TRUE)
plot(density(x$result), xlim=c(min(x$result), max(x$result)), col="red",
     lwd=2, xlab="", ylab="", axes=FALSE, main="")

x <- result2
truehist(x$result, xlim=c(min(x$result), max(x$result)),
         xlab="コンプまでの回数", ylab="人数", prob=FALSE)
legend(500,800,
       legend=c("出現確率 [100, 50, 10, 10, 3, 1]",
                paste("平均", round(mean(x$result), 1)),
                paste("標準偏差", round(sd(x$result), 1)),
                paste("中央値", median(x$result)),
                paste("最大値", max(x$result))))
par(new=TRUE)
plot(density(x$result), xlim=c(min(x$result), max(x$result)), col="red",
     lwd=2, xlab="", ylab="", axes=FALSE, main="")

x <- result3
truehist(x$result, xlim=c(min(x$result), max(x$result)),
         xlab="コンプまでの回数", ylab="人数", prob=FALSE)
legend(75,600,
       legend=c("出現確率 [5, 5, 3, 3, 2, 1]",
                paste("平均", round(mean(x$result), 1)),
                paste("標準偏差", round(sd(x$result), 1)),
                paste("中央値", median(x$result)),
                paste("最大値", max(x$result))))
par(new=TRUE)
plot(density(x$result), xlim=c(min(x$result), max(x$result)), col="red",
     lwd=2, xlab="", ylab="", axes=FALSE, main="")

x <- result4
truehist(x$result, xlim=c(min(x$result), max(x$result)),
         xlab="コンプまでの回数", ylab="人数", prob=FALSE)
legend(75,1000,
       legend=c("出現確率 [10, 3, 2, 2, 1, 1]",
                paste("平均", round(mean(x$result), 1)),
                paste("標準偏差", round(sd(x$result), 1)),
                paste("中央値", median(x$result)),
                paste("最大値", max(x$result))))
par(new=TRUE)
plot(density(x$result), xlim=c(min(x$result), max(x$result)), col="red",
     lwd=2, xlab="", ylab="", axes=FALSE, main="")
描画ももっとスマートな方法がありそう。
軸の目盛もちゃんと合わせた方がいいよなぁ。
ちなみに実行速度は
system.time(result1 <- gacha.sim(c(  1,  1,  1,  1, 1, 1)))
# ユーザ   システム       経過
#     4.94       0.33       5.27

system.time(result2 <- gacha.sim(c(100, 50, 10, 10, 3, 1)))
# ユーザ   システム       経過
#    31.11       0.20      31.47

system.time(result3 <- gacha.sim(c(  5,  5,  3,  3, 2, 1)))
# ユーザ   システム       経過
#    5.99       0.20       6.20

system.time(result4 <- gacha.sim(c( 10,  3,  2,  2, 1, 1)))
# ユーザ   システム       経過
#    6.85       0.22       7.07
ちょっと思ったこととして、我々がガキの頃1回20円で回してたガチャガチャは非復元抽出だったわけだけど、今のソーシャルゲームのガチャは復元抽出なんだよね。
そのあたりが感覚的にわかりにくくて文句言う人が出てきてるのかも。
なお、coupon collector's problemについてはこちらのびいだまブログさんの記事も参考になります。
【追記】
期待通りにビッキーさんがやってくれました!
d:id:a_bicky:20120318:1332083264
こちらに載っているgacha.sim2関数は爆速です!
一応、私の環境で試してみると、
library(rbenchmark)
p <- rep(1, 6); benchmark(gacha.sim(p), gacha.sim2(p), replications = 1)
#            test replications elapsed relative user.self sys.self user.child sys.child
# 1  gacha.sim(p)            1    6.27 2.125424      5.95     0.29         NA        NA
# 2 gacha.sim2(p)            1    2.95 1.000000      2.95     0.00         NA        NA

p <- c(100, 50, 10, 10, 3, 1); benchmark(gacha.sim(p), gacha.sim2(p), replications = 1)
#            test replications elapsed relative user.self sys.self user.child sys.child
# 1  gacha.sim(p)            1   44.72  17.0038     44.35     0.33         NA        NA
# 2 gacha.sim2(p)            1    2.63   1.0000      2.62     0.00         NA        NA
すげー。
3倍から22倍も早くなってる。

